Creating a Node-RED dashboard for OPC UA communication
13. February 2024 – Video

Creating a dashboard for OPC UA
With the ACCON OPC UA Server, you can communicate with PLCs of the type S7-1200, S7-1500, S7-300, S7-400 and SINUMERIK controllers. The creation of a dashboard for this is done in the same way for all of them. In the tutorial, we use the None security setting to simplify matters. For your practical application, we recommend using a higher security setting.
Preparing the tools
- Start OPC Server: Start the ACCON OPC UA Server and check with a UA client of your choice, e.g. UaExpert, that you can read the symbols.
- Loading and installing required modules: Open Node-RED. You can install new modules via the Manage palette menu at the top right. Search for and install node-red-dashboard and node-red-contrib-opcua. You now have access to OPC UA and dashboard nodes.
Create flow in Node-RED
- Add OpcUa-Client Node: Drag the OpcUa-Client node into the workspace. Enter the endpoint URL from the ACCON OPC UA Server in the Endpoint field. You can simply copy this via the right-click menu of the ServerConfigurator tray icon if the server is installed on the same computer.
In the node settings, set Action to SUBSCRIBE and define an interval, e.g. 1s. For one-time reading or writing, you can use READ or WRITE here. We set the certificate settings as in the server, in our case to None. - Add variables as OpcUa-Item Node: OpcUa-Item Nodes are dragged into the workspace for the variables to be monitored. Enter the node ID for Item in the settings. Also specify a name, set the data type and confirm the changes with Done.
- Add Inject Node: Drag an Inject Node into the workspace. Remove msg payload and msg topic in the properties. Check Inject once after 0.1 seconds and leave Repeat at none. Confirm the settings with Done.
- Check flow - Add Debug Node: A Debug Node is used to check whether everything is working. Add it by dragging it into the workspace. To output the message in JSON format, set the debug output to complete msg object. After pressing Deploy, the variable values are displayed in the debug window. The variable monitoring setup is now complete. In this way, you can track changes to variables and react to them if necessary.
- Display several variables - Add Switch Node: If you want to monitor several variables, use a Switch Node. Enter the name of the OpcUa-Item Node, replace payload under Property with browseName and confirm with Done.
- Create Tabs and Groups: A tab and a group are required for the dashboard. These can be found on the right in the dashboard menu. First add a tab and then a group.
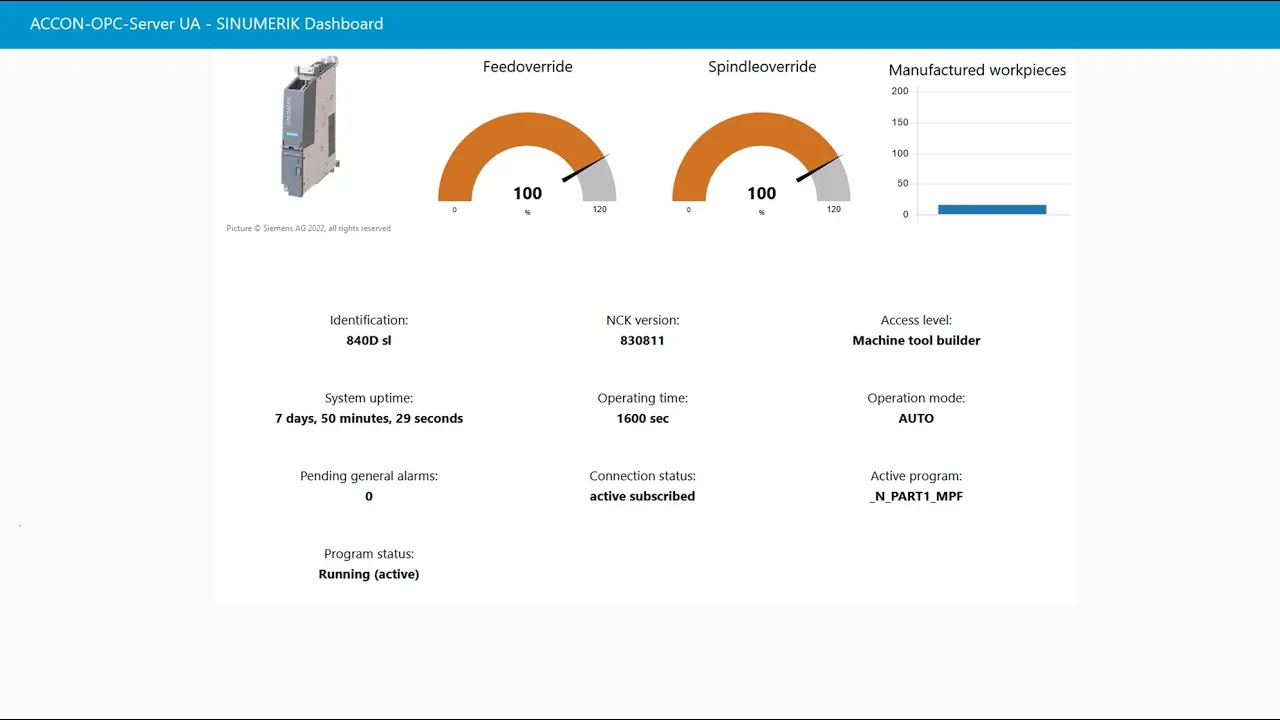
- Display variables - Add dashboard Text Node: Add a Text Node to display the variables. Select the group you have just added in the settings. Enter the heading under Label and confirm with Done. Press Deploy to display the first field in the dashboard.
- More variables - Add dashboard Gauge Node: Create another variable as before. This time, for example, add a dword: Add an OpcUa-Item Node. To do this, copy the Node ID and variable type from the AddressSpaceConfigurator and assign a name. Now create this item in the Switch Node. This time, use a Gauge as the output. Press Deploy again. Both variables are now displayed on the dashboard.
More questions about the ACCON OPC UA Server?
On our YouTube channel we offer you a special OPC UA Server Playlist with various tutorials
about the ACCON OPC UA Server. All information about the product,
technical details and a free demo version can be found on the ACCON OPC UA Server product page. If you have any questions about the product and
its use in your application, please do not hesitate to contact us via
our contact form or by phone at +49 7171 916-120.

